Custom Rating Visualization with Tableau
Stephanie Fisher
/ 2016-11-11Star ratings have become a staple for assessing review sentiment online. We see them all the time when we shop and can quickly associate whether a review is worth reading based on the 1 star vs 5 stars attached to the review. Given the popularity, I recently included star ratings by product in a dashboard designed for an executive audience. The visualization is intuitive and straight to the point. However, I started thinking why stars and not other shapes? To test out using other shapes, I kept it simple and fun. Star ratings, or in this case custom shape ratings are easy to do in Tableau. I’ve outlined my steps and methodology below.
Custom Shape Image
For the custom shape itself, I opted for png icon with a transparent background and created different deviations of the shape that would indicate proportions. There are only two colors defined – black and brown. The shape is also easily recognizable.

Beer bottles. I like beer and there is a fast growing craft brew industry in Texas. I pulled the Top 100 rated beers from Beer Advocate to see what beers I need try within the State.
Rating Calculations
Leveraging Tableau, I imported the data, which included a Weighted Rating (WR) based on reviews and ratings for a given beer. I used WR for the bottle rating. In order to achieve this, I need to define what qualified as 1 Beer, 2 Beer, 3 Beer, 4 Beer, and 5 Beer ratings. I created the following calculated fields:
1 Beer if ([WR*])>=0.875 then 1 else null end
2 Beer if ([WR*])>=1.875 then 2 else null end 3 Beer if ([WR*])>=2.875 then 3 else null end
4 Beer if ([WR*])>=3.875 then 4 else null end
5 Beer if ([WR*])>=4.875 then 5 else null end Now, what if a beer rating was a fraction? This required additional calculated fields to position the fraction and display them within the beer bottles.
Position .25 Beer if round(([WR*]-int([WR*]))4)=1 then int([WR])+1 else null end
Position .5 Beer if round(([WR*]-int([WR*]))4)=2 then int([WR])+1 else null end
Position .75 Beer if round(([WR*]-int([WR*]))4)=3 then int([WR])+1 else null end
How does the formula work? First, the formula rounds the WR and then subtracts the difference of the WR integer value, then it multiplies by 4 to find the qualifying quarter. Here’s an example with numbers. WR = 4.47. (4.47-4) *4 = 1.88 -> round 1.88 = 2 (The value 2 qualifies for our .5 Beer position) If 2 then take 4 + 1 = 5 -> This is value acts as a placeholder and get assigned a shape. Anything that doesn’t qualify is null.
Additional Consideration- Placeholders
Another consideration I had was to have place holders for each available rating spot. For example, if I have a beer with WR of 4, I would see 4 full beer bottles and 1 empty beer bottle. The intention of the design was for consistency and to quickly identify opportunity for higher WR value. To achieve this, I created the following calculated fields:
No 1 Beer if ([WR*])<0.875 then 1 else null end
No 2 Beer if ([WR*])<1.875 then 2 else null end
No 3 Beer if ([WR*])<2.875 then 3 else null end
No 4 Beer if ([WR*])<3.875 then 4 else null end
No 5 Beer if ([WR*])<4.875 then 5 else null end Adding Custom Shapes to Tableau
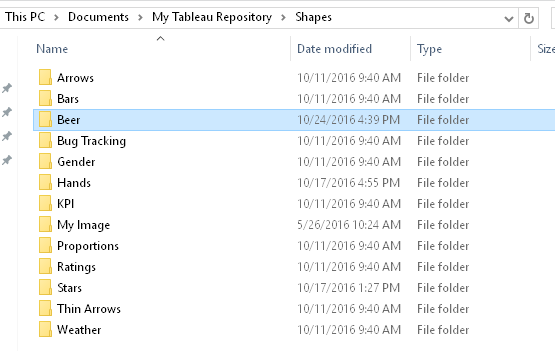
Now, a few more steps. I need to assign beer bottle shapes to the values. To have the shapes available, I added the different beer bottle pngs to a folder called “Beer” and placed the folder under My Tableau Repository > Shapes.
In tableau, I created my grid.

- I added the values/attributes I wanted to see on the grid to Rows.
- I dragged measure names to the filters. I selected the calculated fields for 1 Beer, 2 Beer, 3 Beer, 4 Beer, 5 Beer, Position .25, Position .50, Position .75, No Beer 1, No Beer 2, No Beer 3, No Beer 4, and No Beer 5

- I added Measure Values to Columns.
- On the Marks card, I hit the drop down for Shapes. Next I dragged Measure Names over the Shape box.
- To edit/assign the shapes, click the shapes box. (You may need to select Reload Shapes if you’re not seeing the new shapes added.) I assigned the shapes to the given calculated fields:

- The rest is formatting. Under the format menu > cell size > Taller/Narrower options are available. I also choose to remove grid lines, etc.
Final Product – Tableau Dashboard
Click here to view the Dashboard
Citations
The following sources were referenced for creation of this Tableau Dashboard: [https://community.tableau.com/thread/182452 https://community.tableau.com/thread/196696](https://community.tableau.com/thread/182452 https://community.tableau.com/thread/196696) Special thanks to Le Bui for his contributions.